TREND: Trending on Godel Command
TREND is the Godel Terminal command for viewing the most-searched tickers in Godel, ranked by search count across all users with timeframe filters from 1 hour to 1 month.
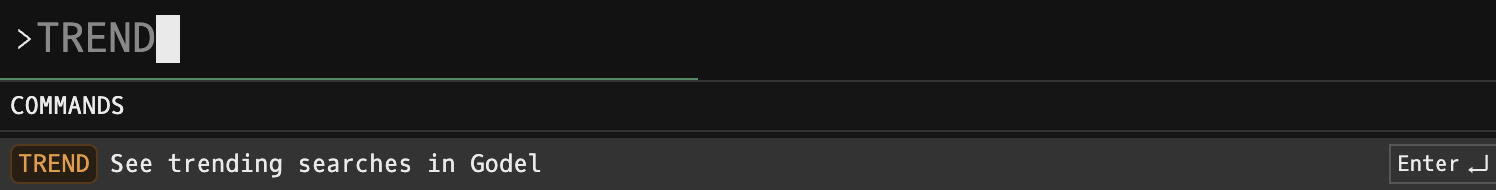
How to use TREND
Command:
TREND
Timeframe Tabs
Select a timeframe to filter trending data:
| Tab | Window |
|---|---|
| 1H | Searches in the last hour, shown in minute intervals. |
| 24H | Searches in the last 24 hours, shown in 1-hour intervals. |
| WEEK | Searches in the last week, shown in 1-hour intervals. |
| MONTH | Searches in the last month, shown in 1-hour intervals. |
Click the refresh icon (⟳) to manually update results. Data automatically refreshes every 30 seconds.
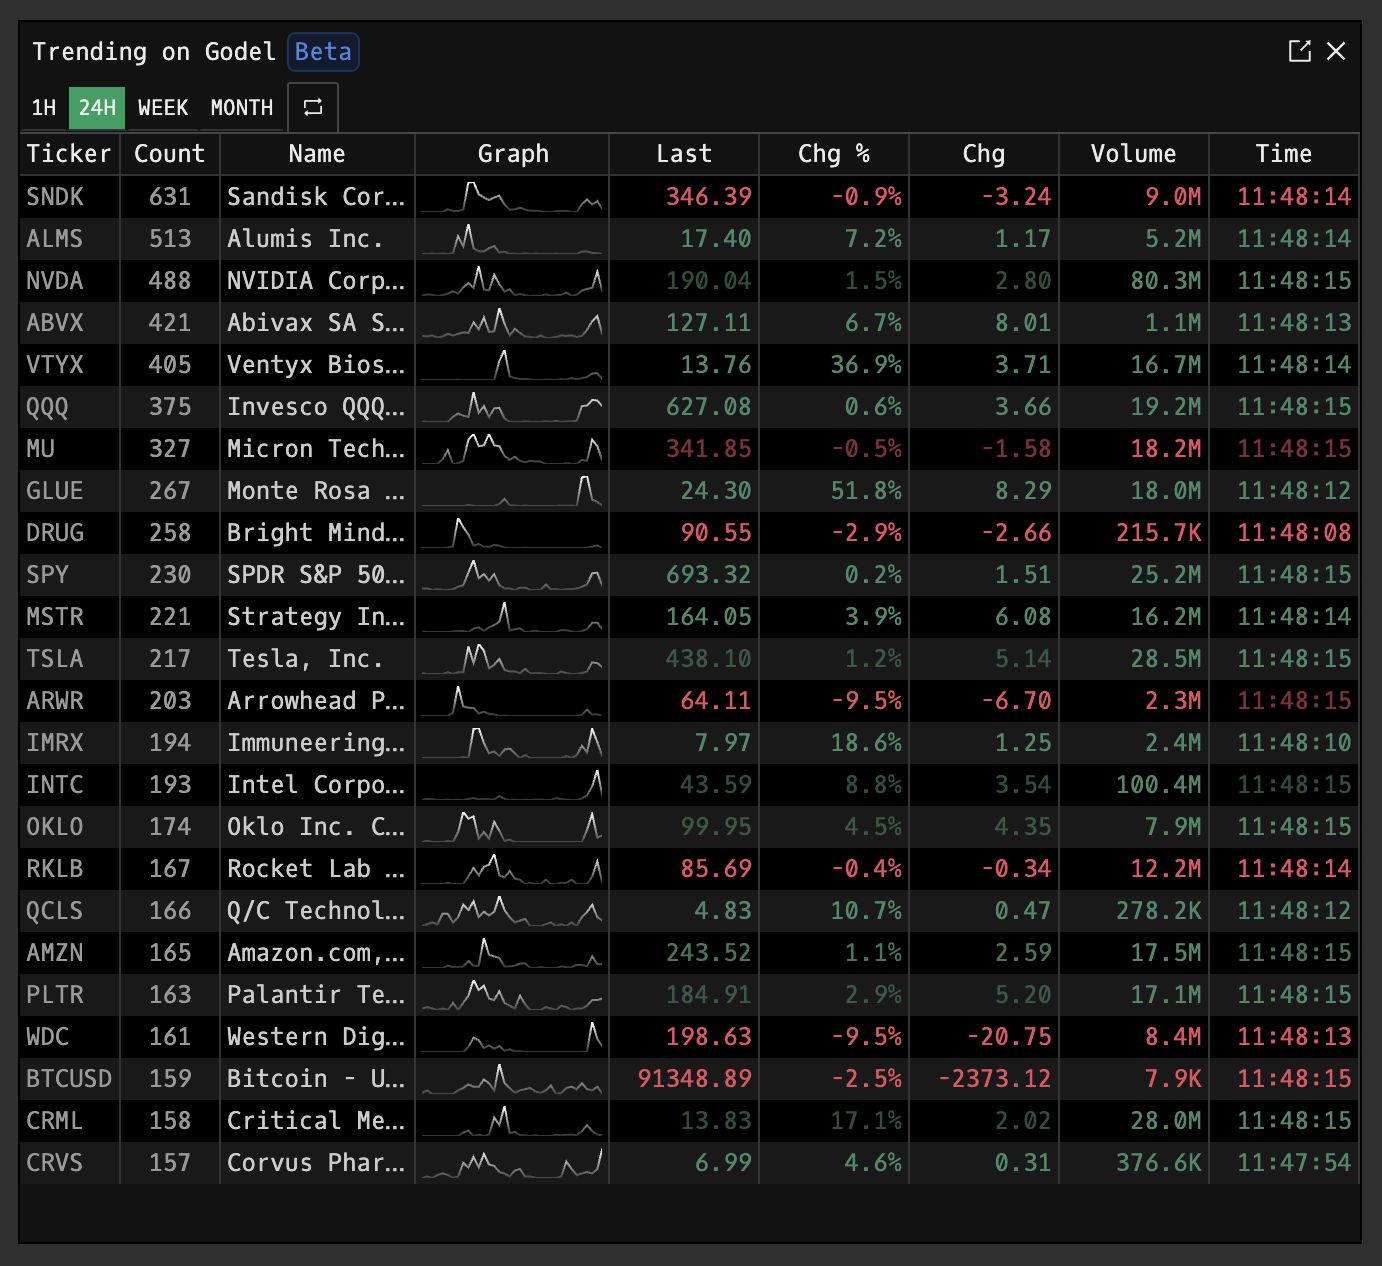
Display Columns
| Column | Description |
|---|---|
| Ticker | Security symbol |
| Count | Total searches within the selected timeframe |
| Name | Company or instrument name |
| Graph | Sparkline showing search activity distribution across the timeframe |
| Last | Current price |
| Chg % | Percentage change from previous close |
| Chg | Absolute price change |
| Volume | Share volume traded |
| Time | Last trade timestamp |
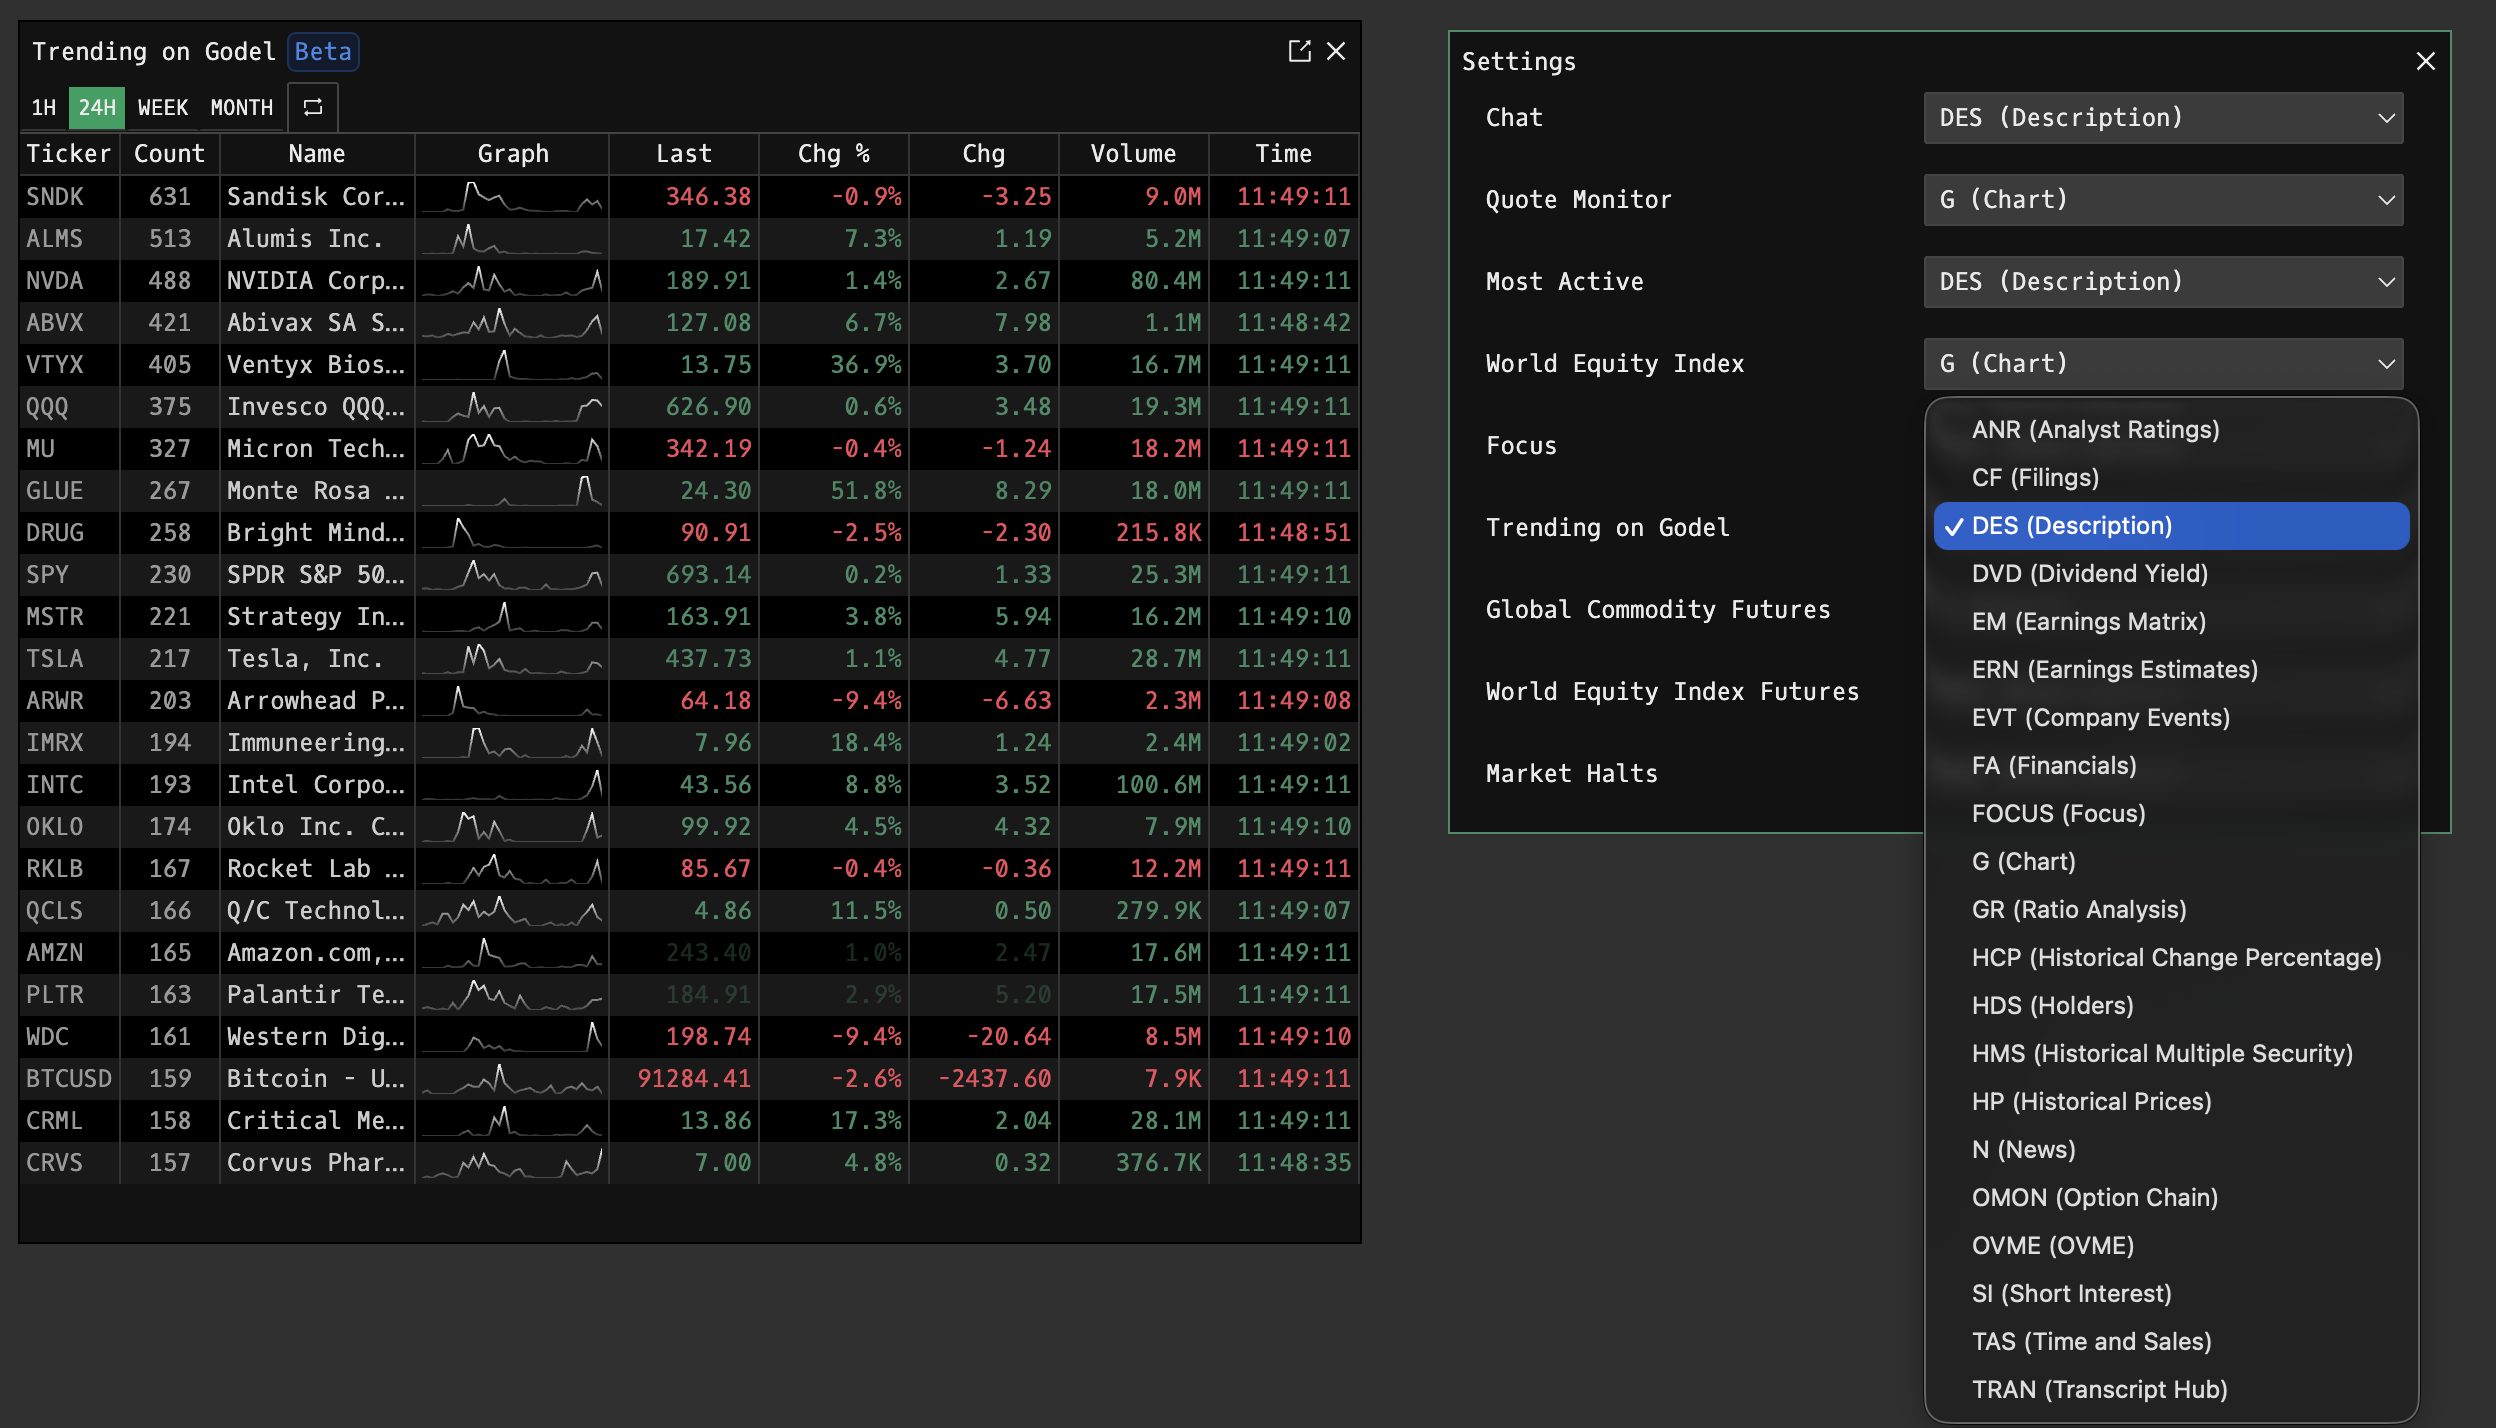
Ticker Click Behavior
Click any ticker to open its default view. This behavior can be customized in settings PDF.
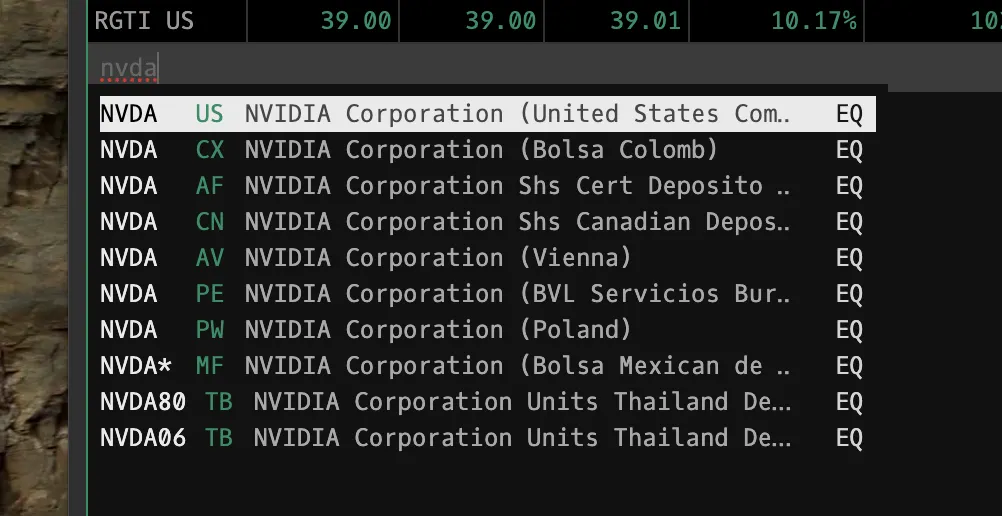
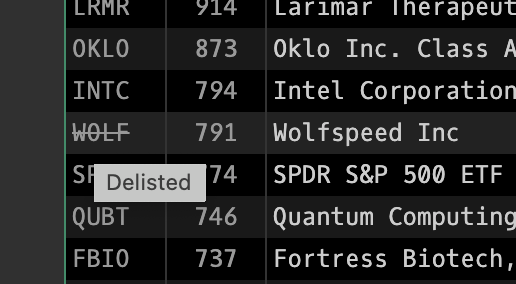
Delisted Securities
If a ticker appears with a strikethrough, it has been delisted. Hover over the ticker to see "Delisted" tooltip. Delisted tickers may still appear in trending if users recently searched for them.
Data Source
Search counts are aggregated across all Godel Terminal users. Any ticker search in any component or the main terminal counts toward the total.