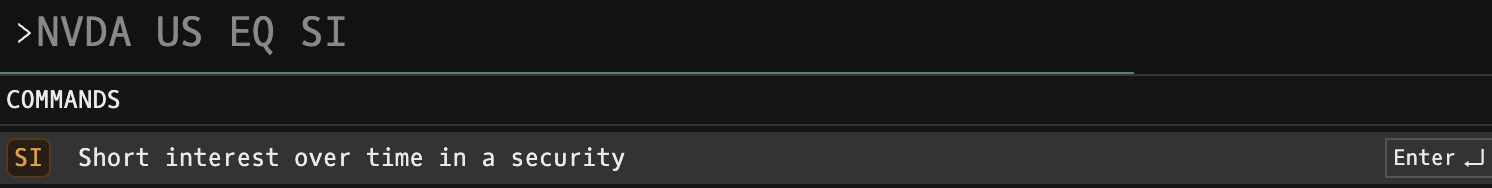
SI: Short Interest Command
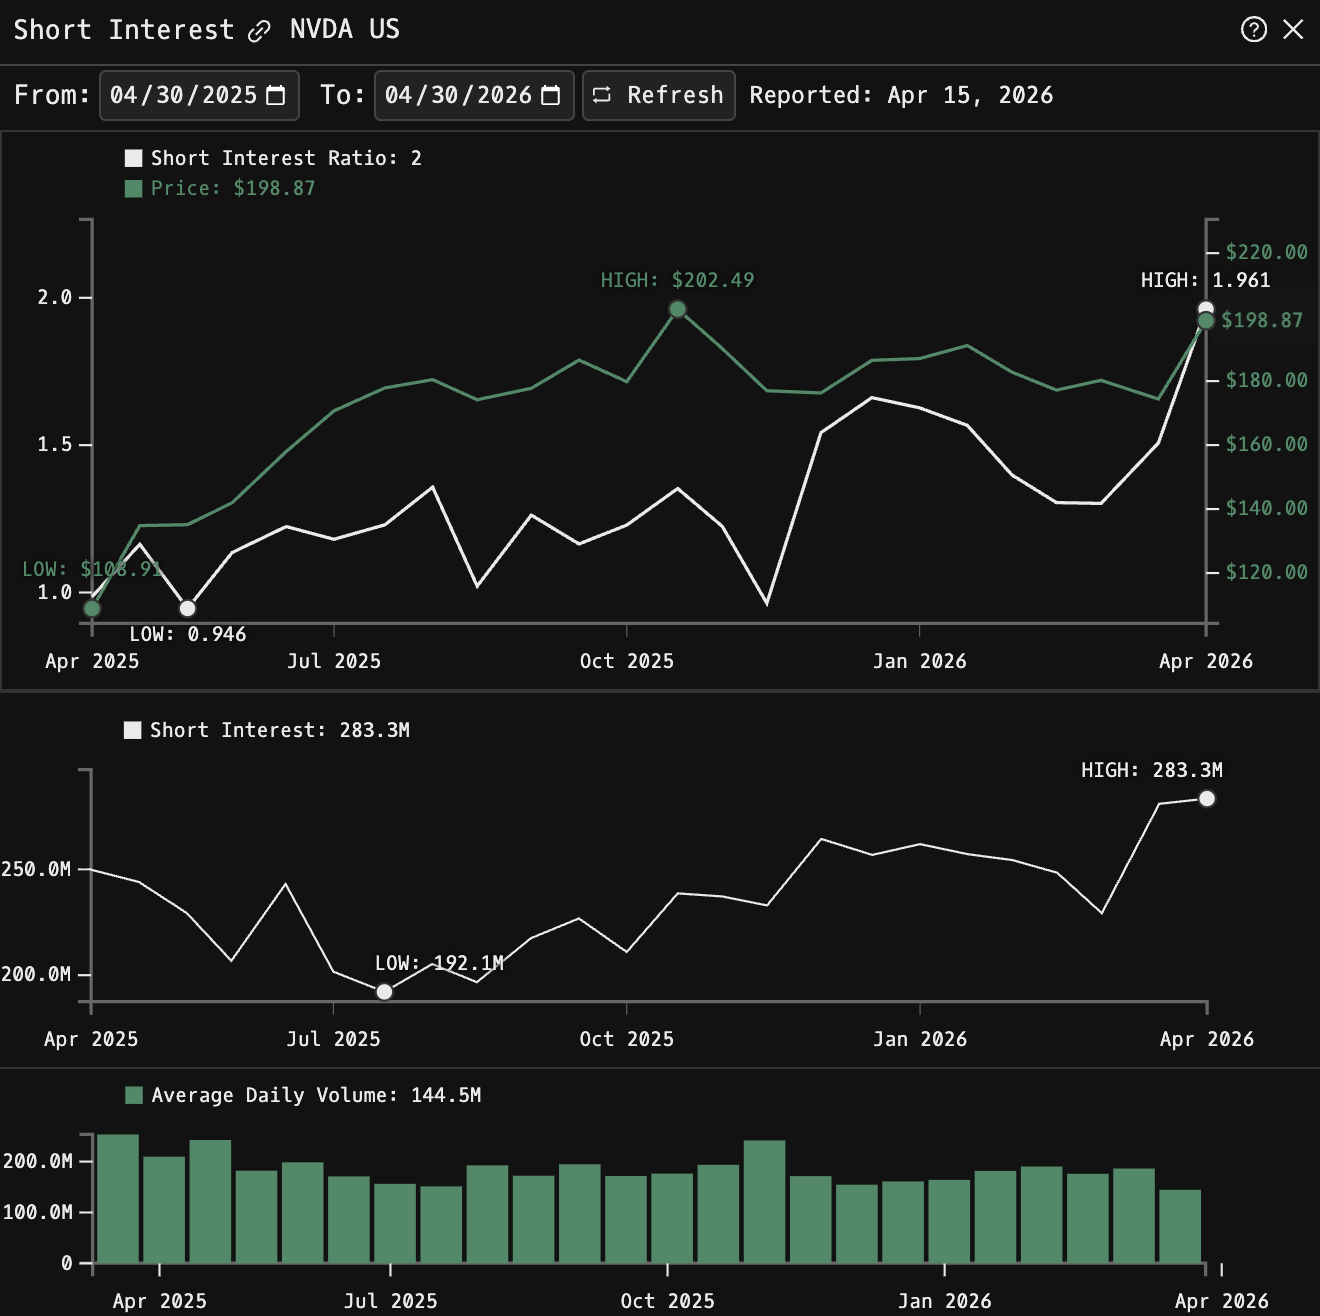
SI is the Godel Terminal command for viewing short interest for a security over time: short positions, stock price, and trading volume together.
How to use SI
Security Identifier/Ticker Country/Instrument Asset Class SI
Example: NVDA US EQ SI - displays concise short interest for Nvidia.
Data & Time Controls
Reporting Frequency: twice monthly via FINRA (typically mid-month and month-end).
Latest Report Date: displayed at the top of the screen
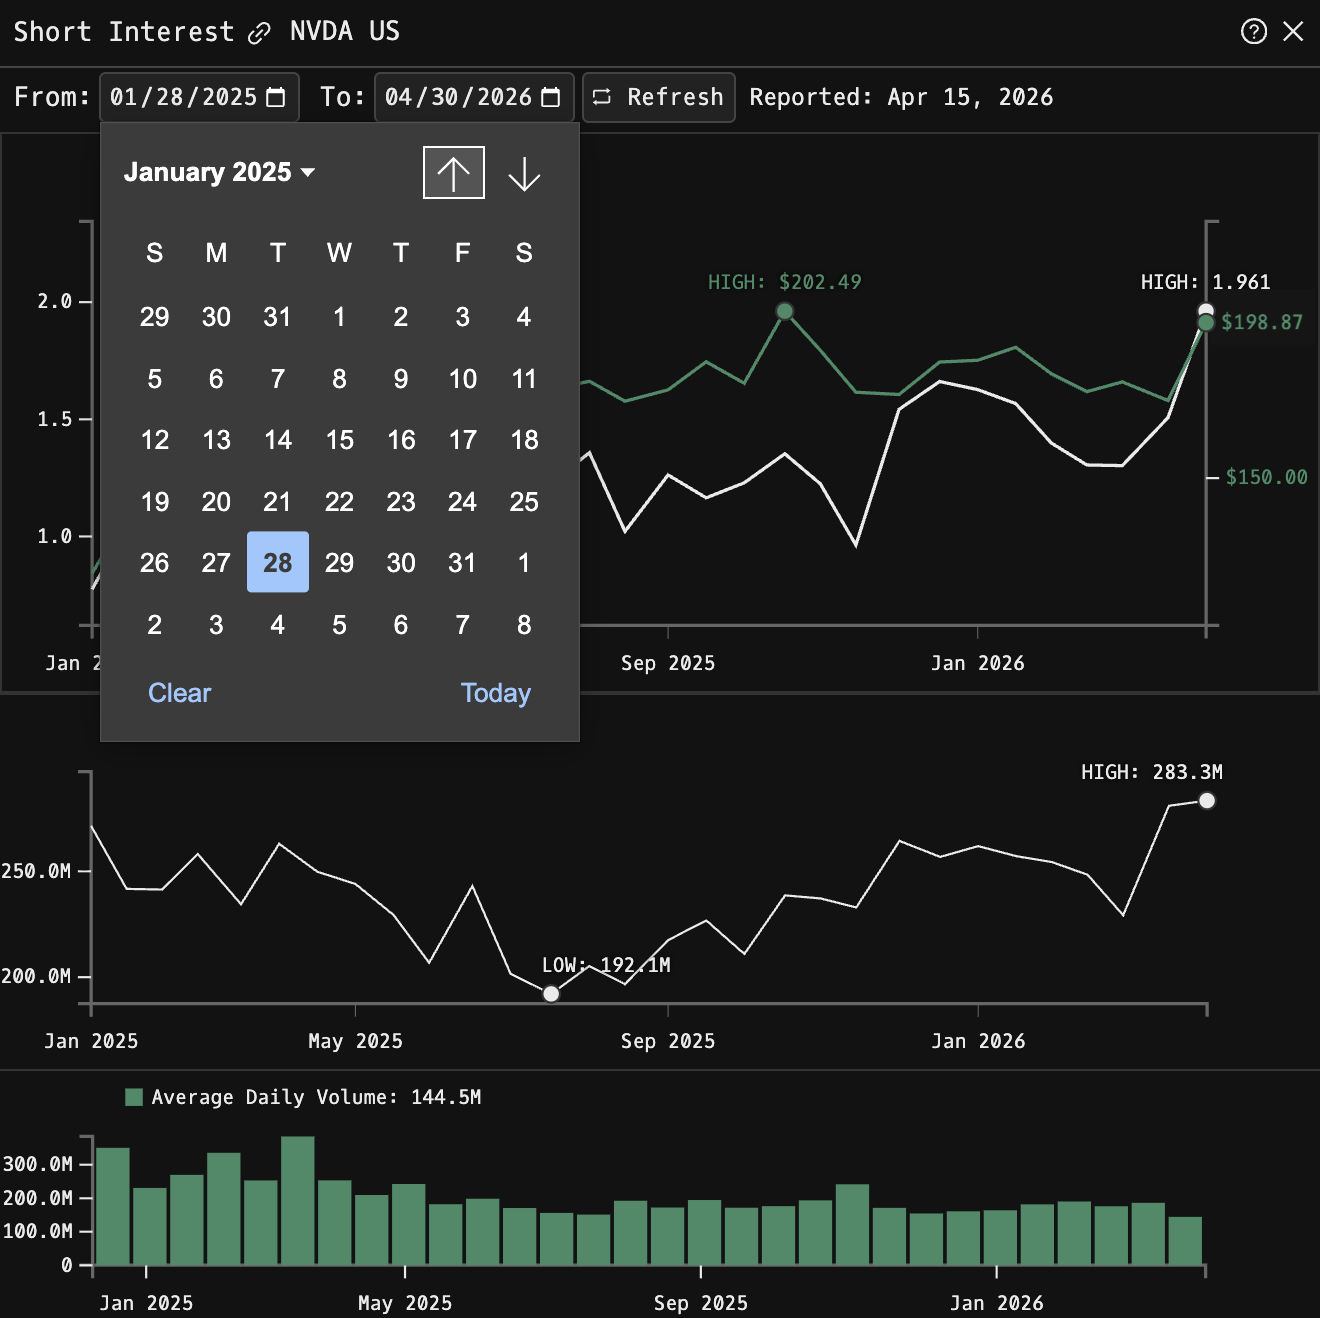
Time Period: use the From/To date fields to adjust the chart timeframe
Default View: one year of data
Extended History: can display multiple years of historical short interest trends (if available)
Refresh: updates to latest available data
Key Metrics Explained
| Metric | Description |
|---|---|
| Short Interest Ratio | Days to cover: short interest divided by average daily share volume. A ratio of 1.26 means it would take about 1.26 trading days to cover all short positions at current volume levels. |
| Short Interest | Total number of shares currently sold short, displayed in millions. |
| Average Daily Share Volume | Average shares traded per day during the reporting period, adjusted for splits and divided by the number of trading days between settlement dates. |
FAQ
What does SI do?
SI is the Godel Terminal short interest command.
How do I open SI in Godel Terminal?
Type SI in the terminal, or prefix with a ticker (for example, NVDA US EQ SI).
Is SI available on all plans?
Yes, SI is available on every Godel plan.
Does SI work for ETFs, indices, or non-US securities?
SI is built around individual equities. ETFs and indices do not carry this data, so it is stock-focused; non-US companies appear where the underlying data is available.