IMAP: Intraday Market Map Command
IMAP (Intraday Market Map) shows the intraday movement of a major index (the S&P 500 or the Dow Jones Industrial Average) broken down by sector and colored by performance, so you can see at a glance what is up and down on the day and which names are driving each move.
How to use IMAP
Command:
IMAP
IMAP is an index-level view, so it does not take a ticker; just run the command. Use the S&P 500 and DJIA tabs to switch indexes, and the Map / Table toggle to switch between the sector wheel and a sortable list of every member.
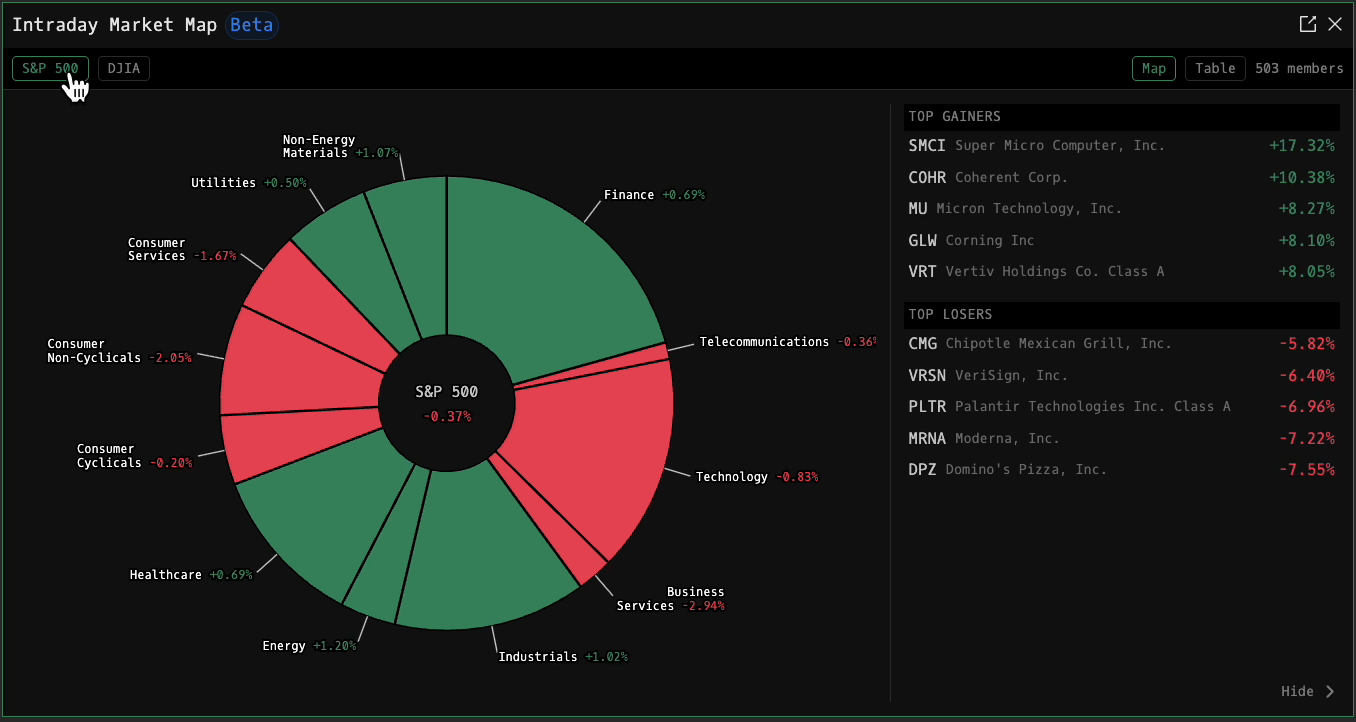
In the Map view, each slice of the wheel is a sector, sized by its weight in the index and colored by its intraday change: green when it is up, red when it is down. The center shows the index's overall change on the day, and the Top Gainers and Top Losers panel on the right lists the strongest and weakest members. Hover any sector to see its member count and change.
Drill into a sector
Click a sector to drill into it. The wheel re-draws to show that sector's sub-industries, the center switches to the sector's name and change, and the Top Gainers and Top Losers panel re-scopes to just that sector's members (for example, Top Gainers for Technology). Click Back in the center of the wheel to return to the full index.
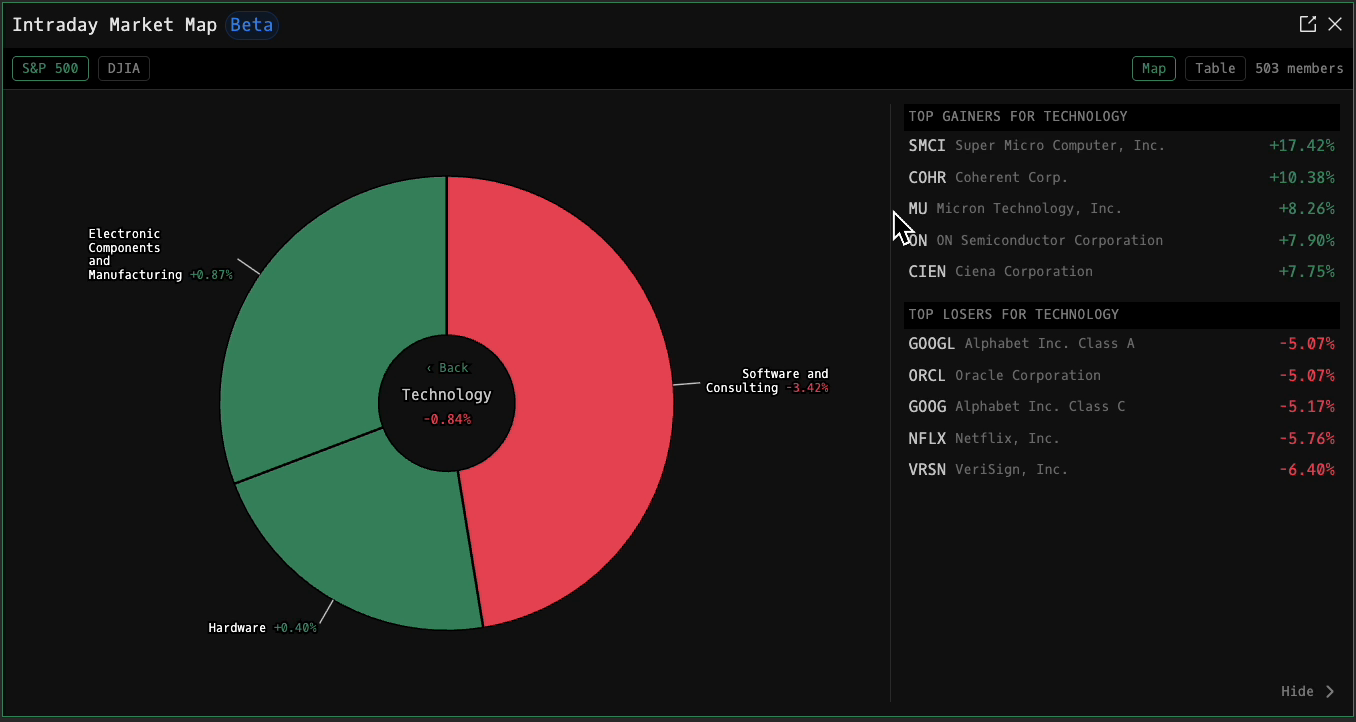
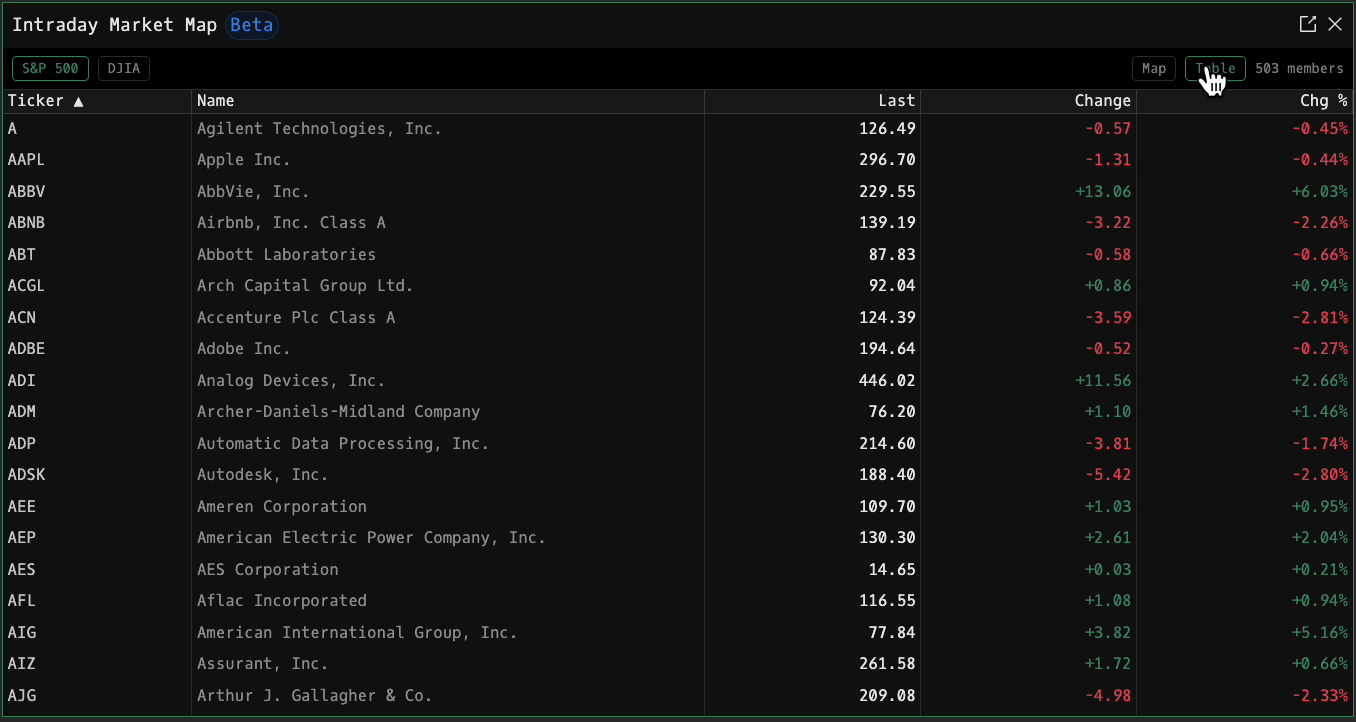
Table view
Switch to the Table view for a sortable list of every member of the index. Click any column header to sort.
| Column | Description |
|---|---|
| Ticker | Member symbol |
| Name | Company name |
| Last | Most recent traded price |
| Change | Change on the day in price terms: green / red |
| Chg % | Change on the day in percent: green / red |