HMAP: Market Heatmap Command
HMAP is the Godel Terminal command for viewing the intraday movement of an index, or any of your watchlists, as a market-cap-weighted heatmap. Tiles are grouped by sector, sized by your chosen metric, and update live. Currently in Beta.
How to use HMAP
Command:
HMAP
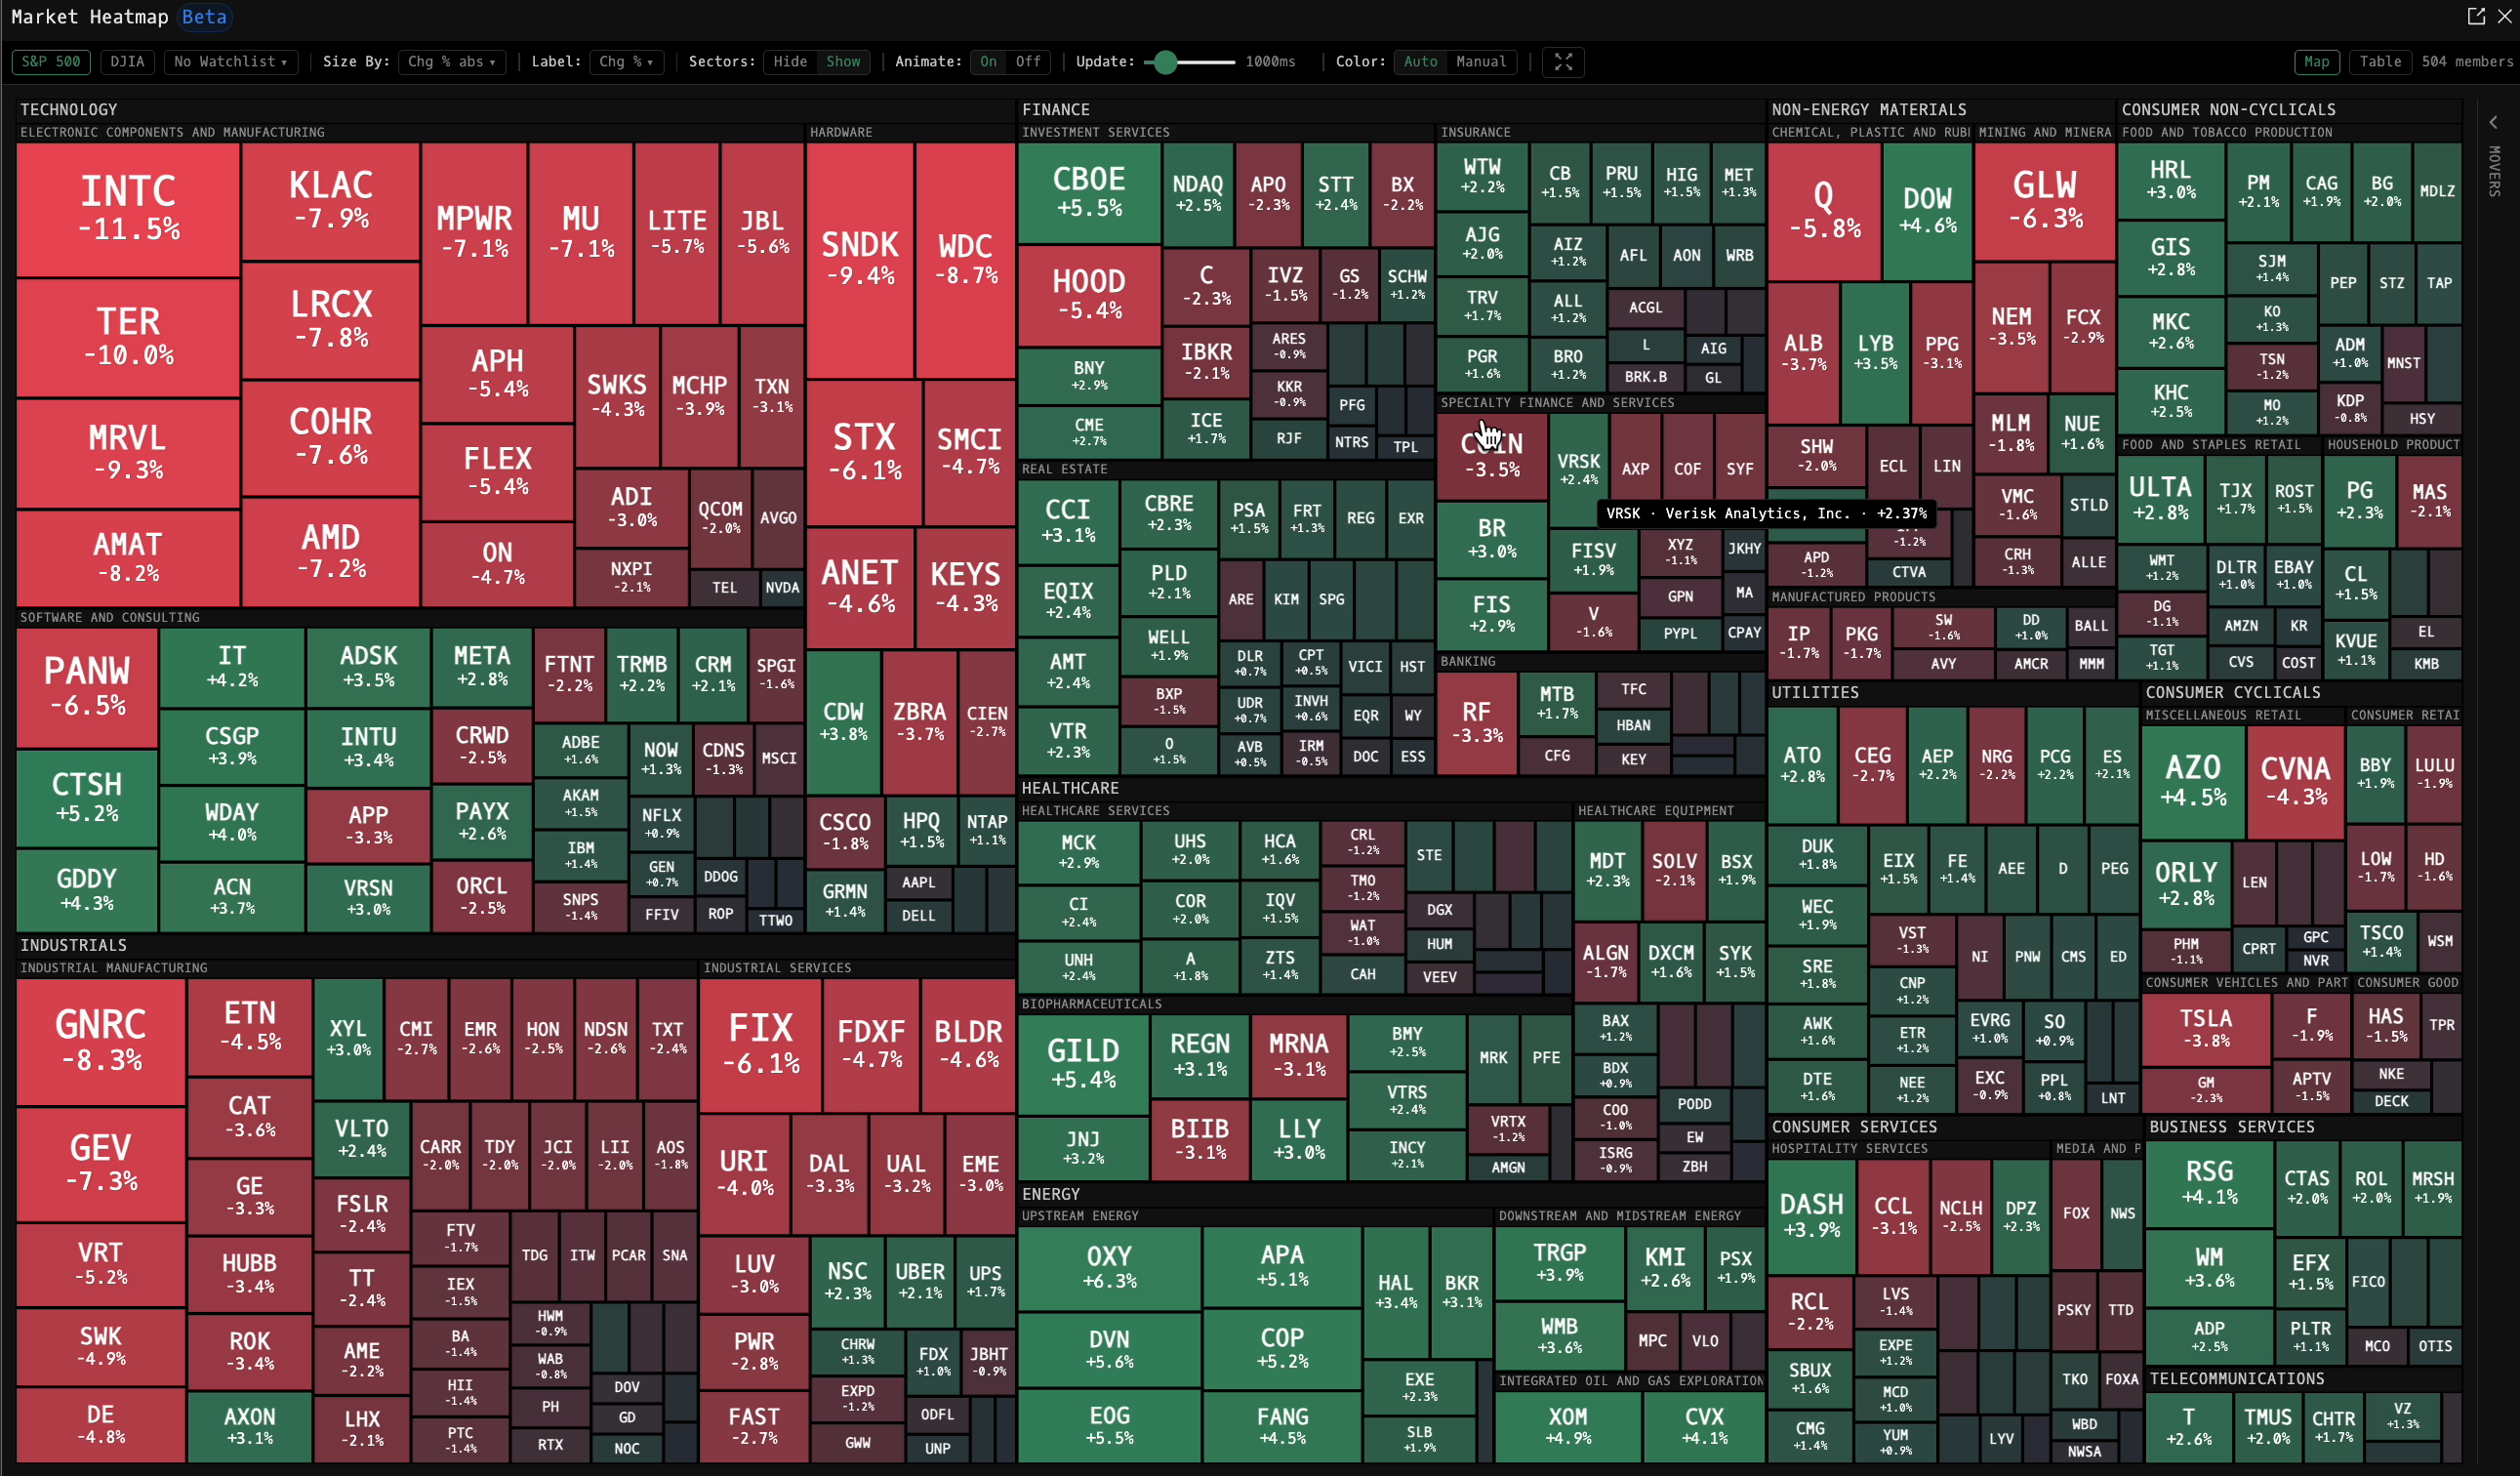
Map an index or a watchlist
The toolbar starts you on the S&P 500 and DJIA presets. The watchlist selector next to them maps any of your own watchlists instead, so the same heatmap works for your coverage universe, a sector list, or anything else you track in QM.
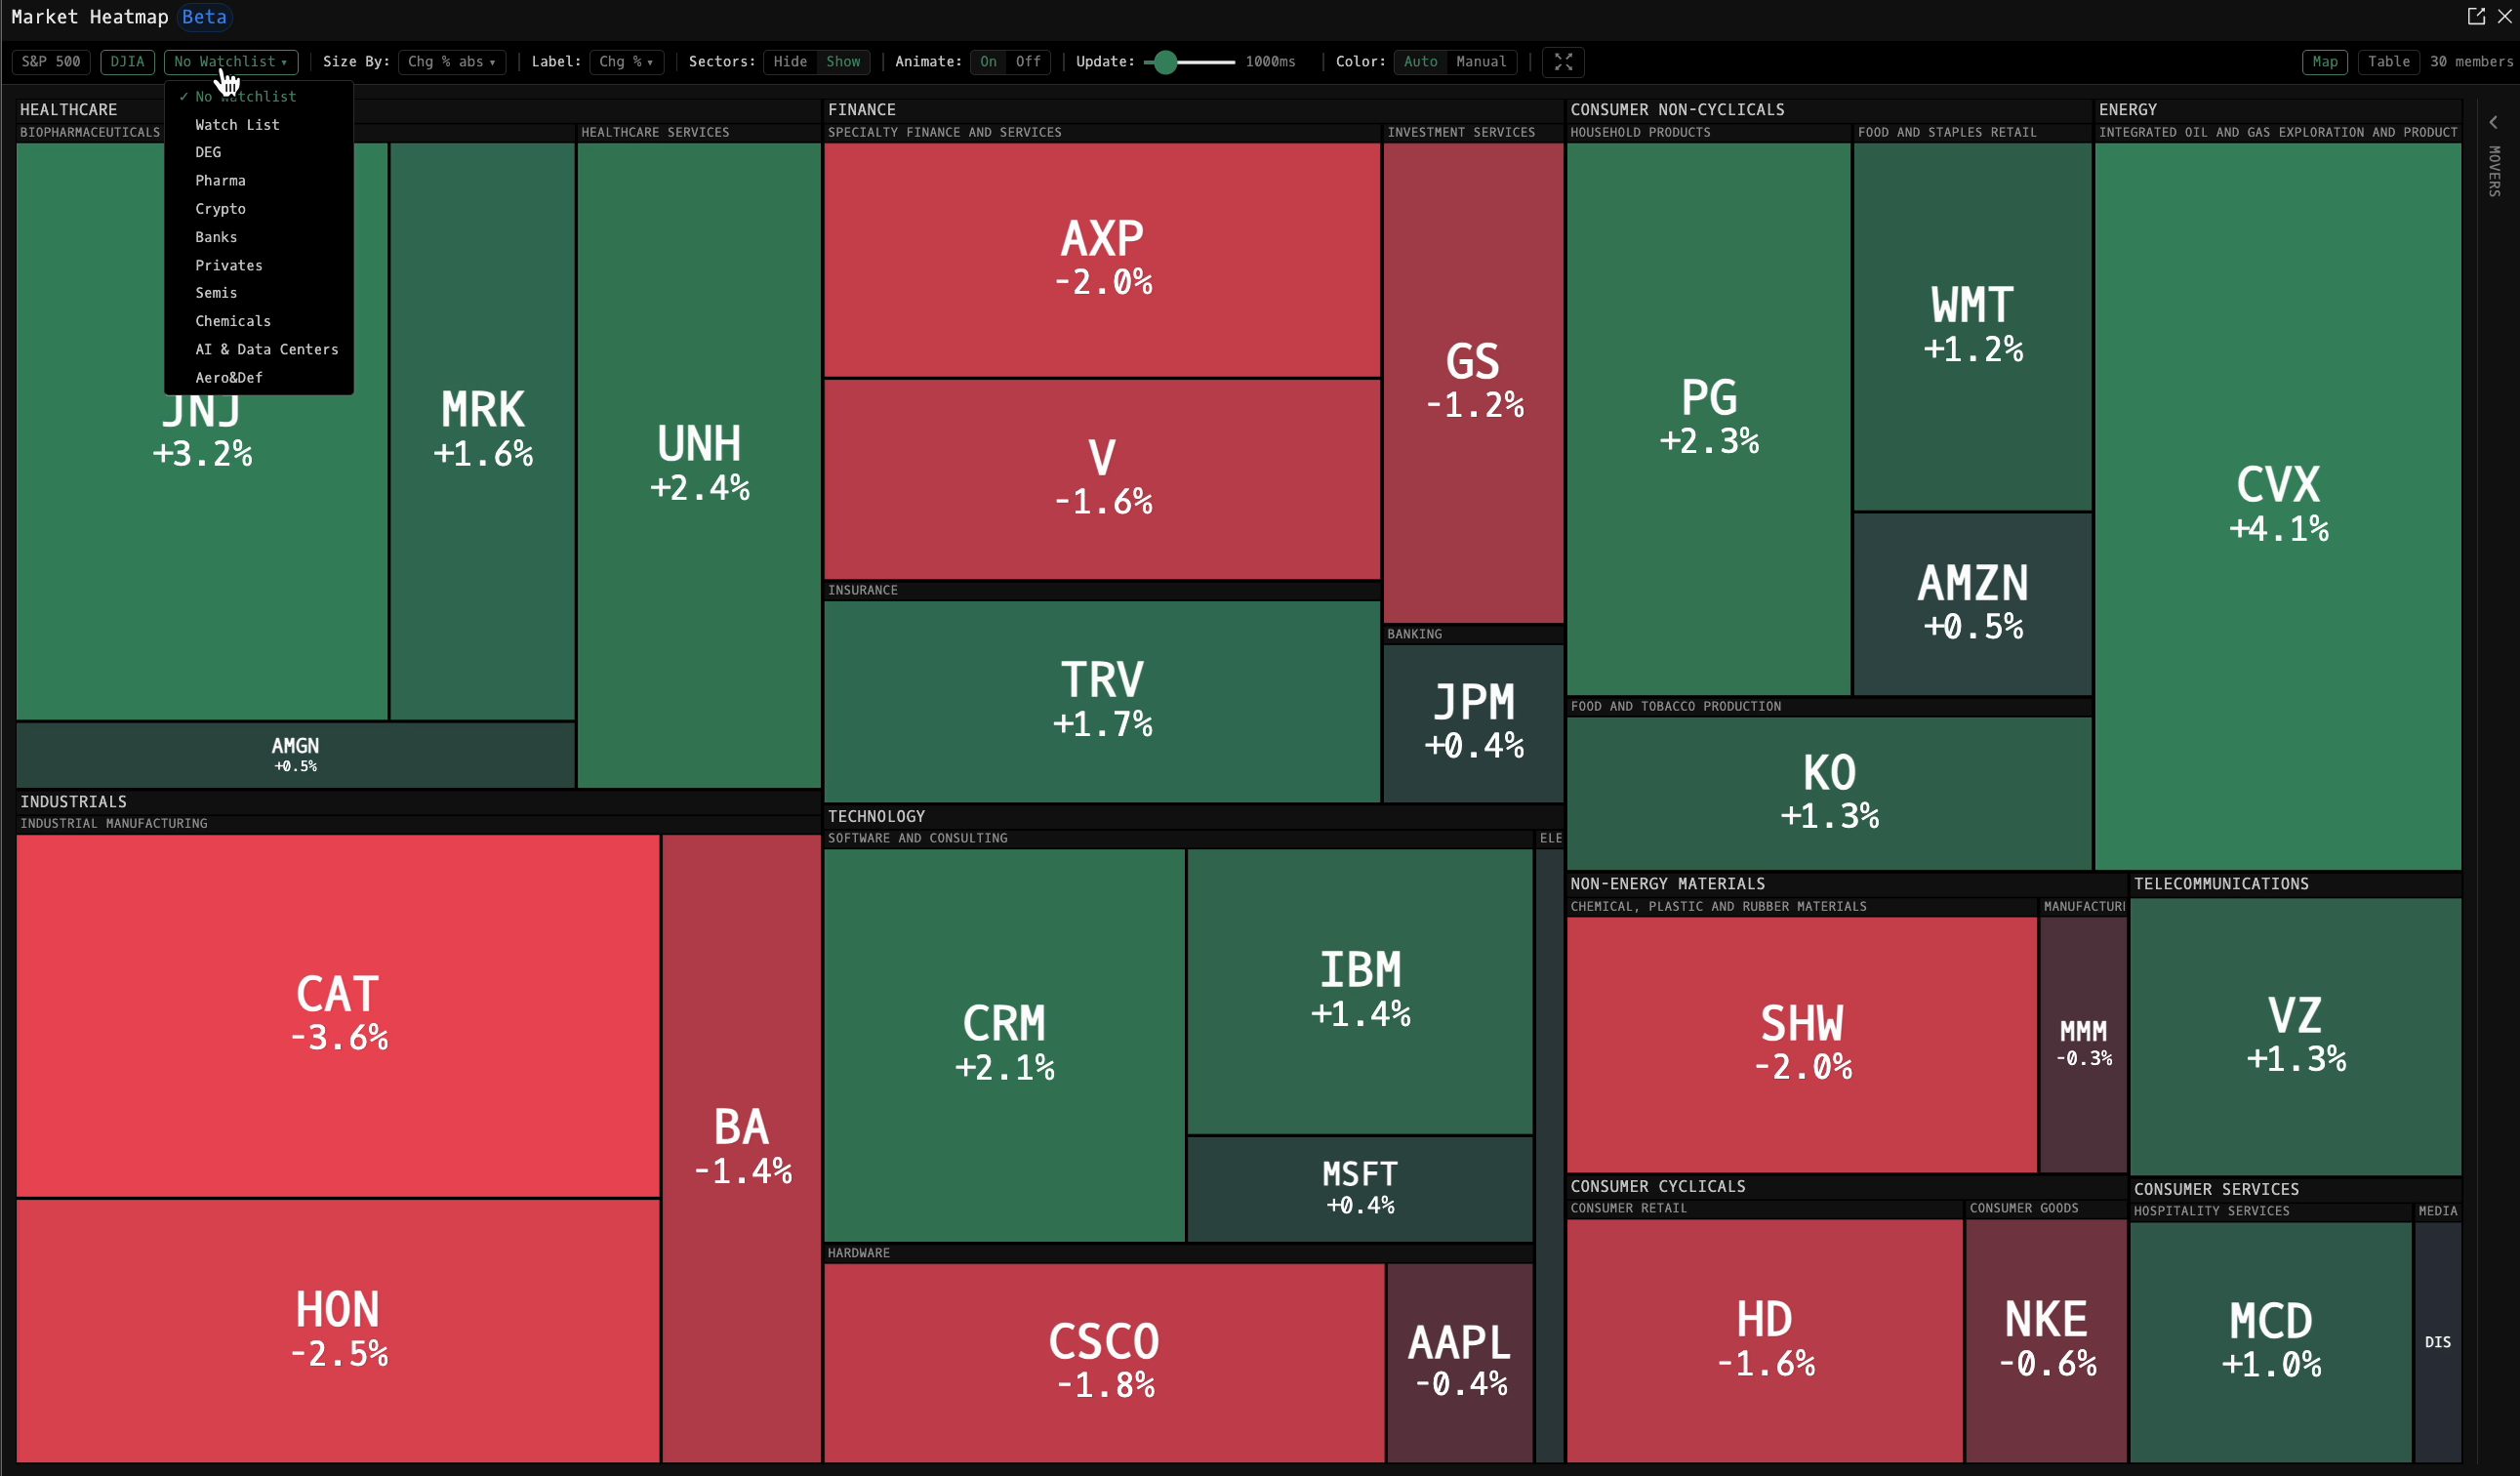
Pick a watchlist and the map redraws with just those names, still sector-grouped and market-cap-weighted:
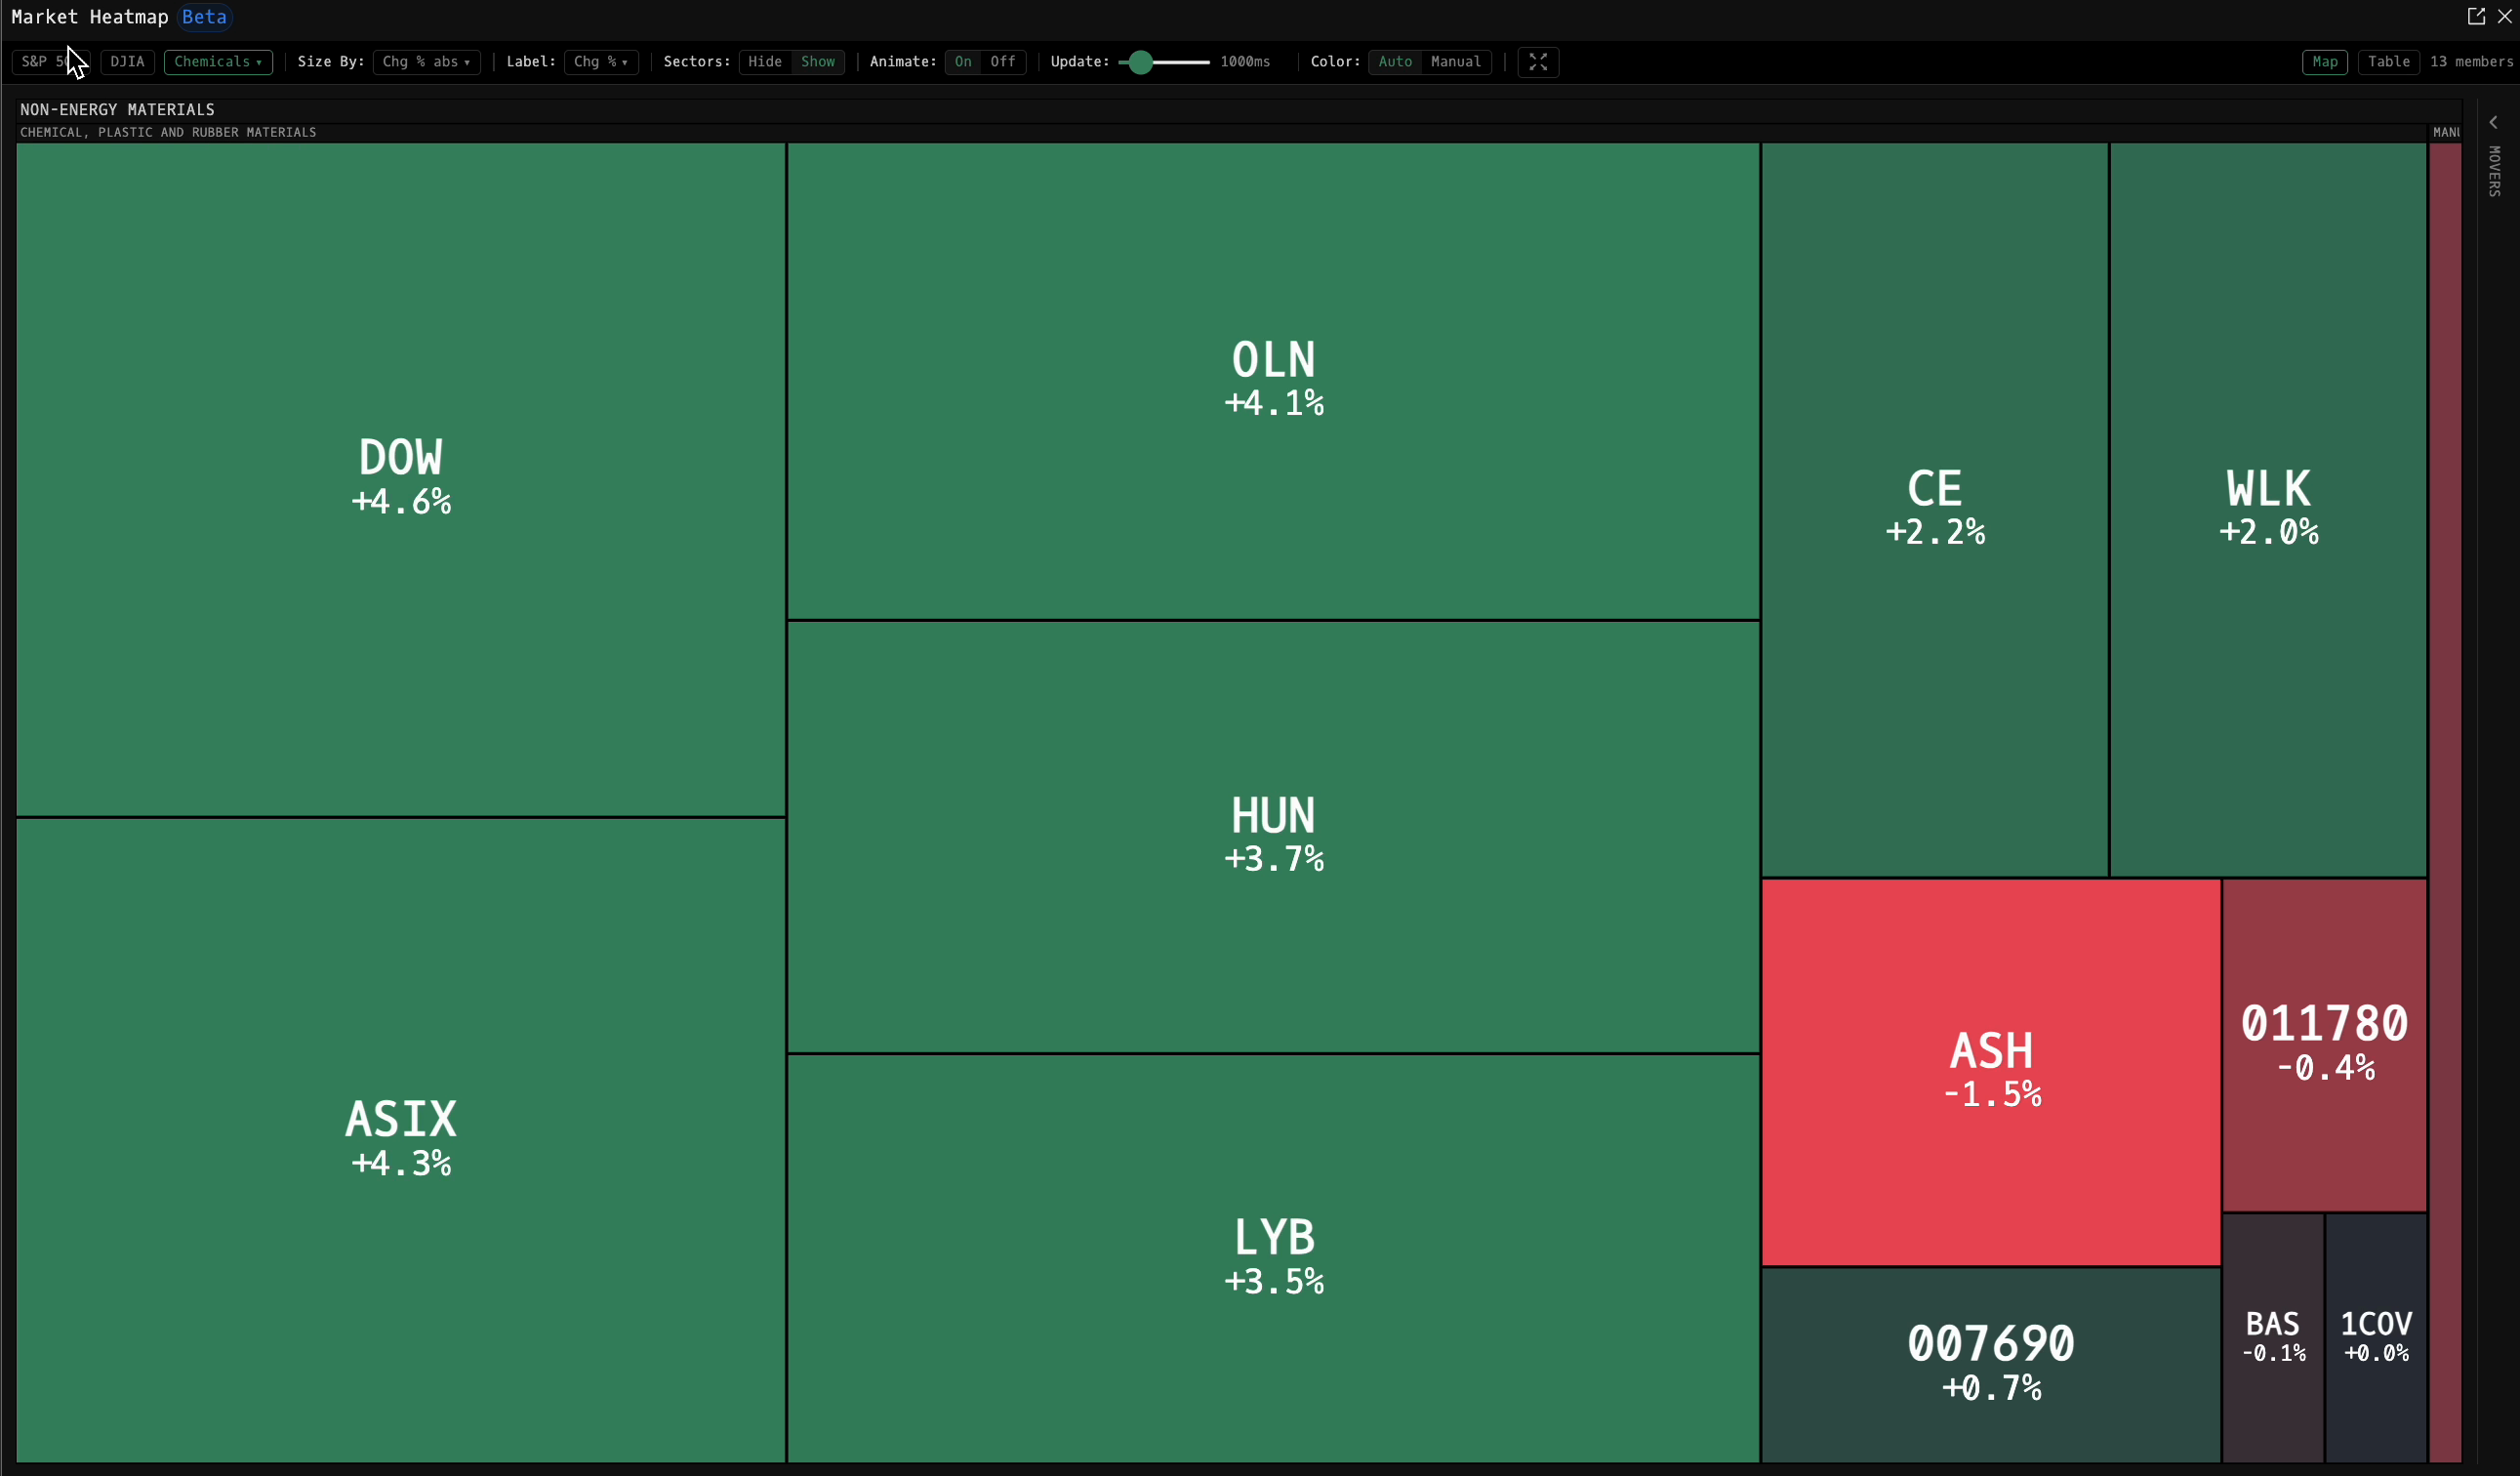
Toolbar controls
| Control | Description |
|---|---|
| S&P 500 / DJIA | Index presets |
| Watchlist | Map one of your watchlists instead of an index |
| Size By | Metric that sets tile size (e.g. absolute % change) |
| Label | Value printed on each tile (e.g. % change) |
| Sectors | Show or hide the sector grouping |
| Animate / Update | Live refresh on or off, with the update interval in milliseconds |
| Color | Automatic or manual color scaling |
| Map / Table | Switch between the heatmap and a sortable table of the same members |
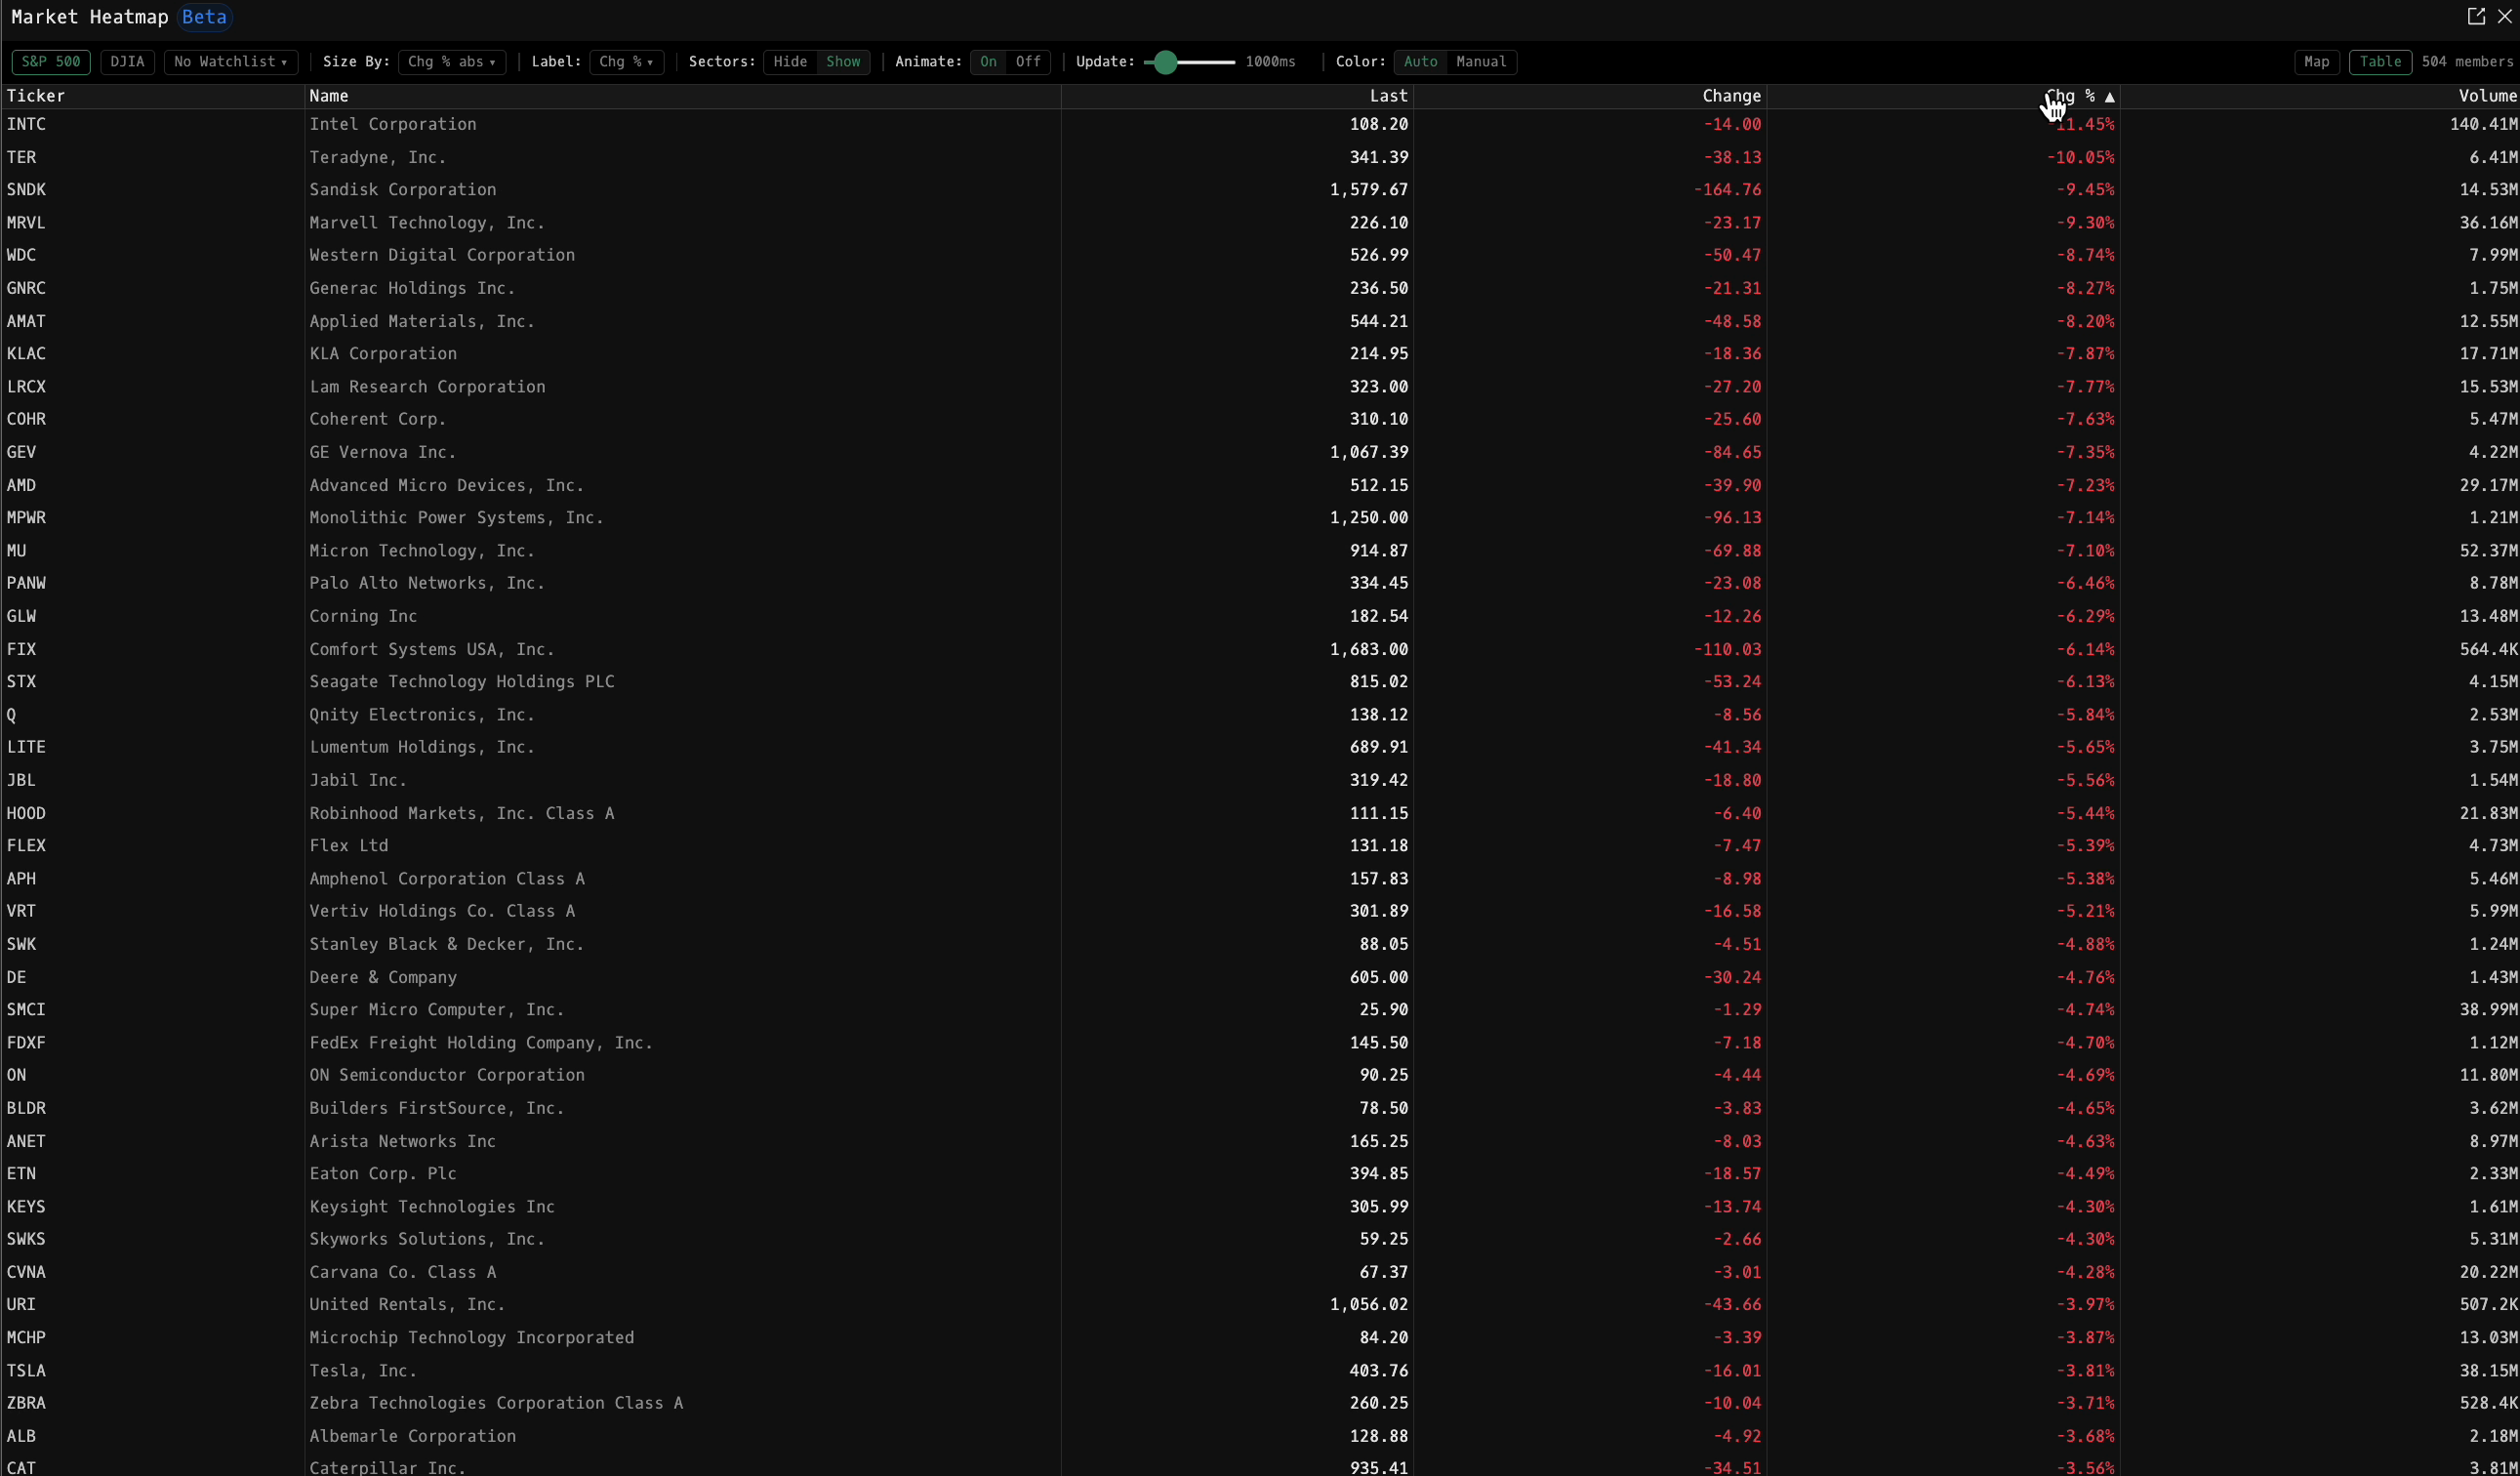
Table view
The Table toggle flattens the map into a sortable list with last price, change, % change, and volume for every member. Sort by any column to rank the whole index or watchlist.
Tile interactions
- Hover a tile for the full name and current change.
- Right-click a tile for quick actions on that security, like opening the quote or its DES description, without leaving the map.
- The Movers panel on the right edge expands to a ranked list of the day's biggest movers in the current view.