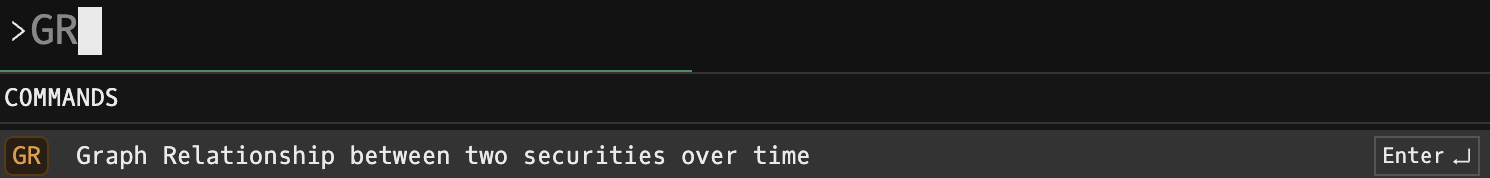
GR: Ratio Analysis Command
GR is the Godel Terminal command for graphing the relationship between two securities over time: ratios, spreads, or correlations.
How to use GR
Global (default):
GR: opens with AAPL vs. SPY as the default pair.
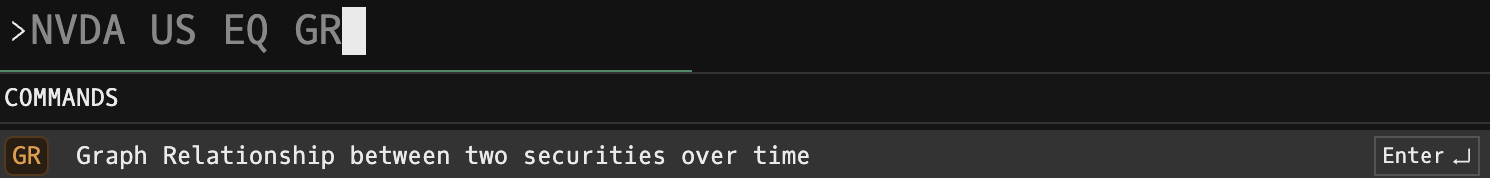
Scoped:
Security Identifier/Ticker Country/Instrument Asset Class GR
Opens with the scoped ticker as the "buy" leg.
Tickers
At the top of the window:
- Buy: the primary / numerator ticker.
- Sell: the comparison / denominator ticker.
Use the inline ticker search next to each to swap either leg. Any pair of the same asset class (equity, ETF, FX, index, futures, crypto) can be compared.
Time Period
Dropdown with presets: 1D, 1W, 1M, 3M, 6M, 1Y, and longer windows where data is available.
Panels
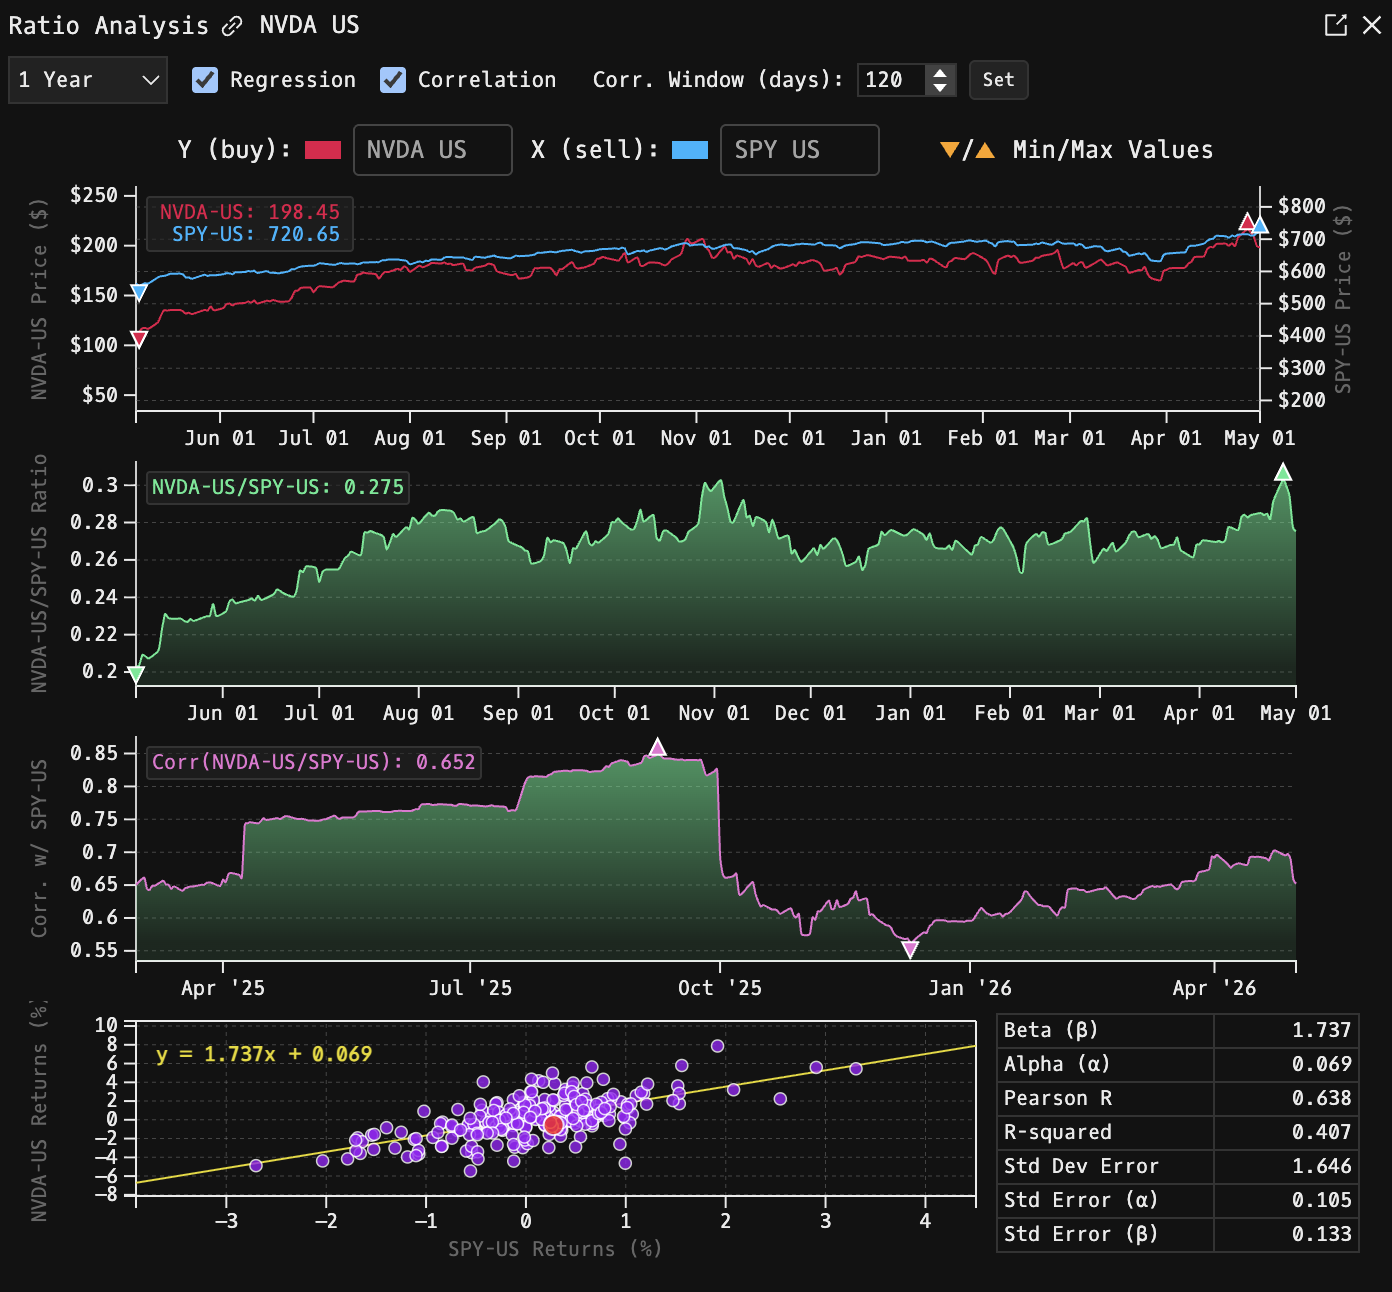
Price Comparison Chart
A dual-axis time series with both tickers plotted on their own y-scale. Legend shows the most recent price for each side; highs and lows for the selected period are marked on the chart.
Ratio Chart
A mountain chart of Buy / Sell. Useful for spotting mean-reversion and persistent drifts in the relationship.
Correlation (optional)
Toggle Correlation on to add a rolling-correlation chart below the ratio. Configure the window length (default 120 observations, min 2, max 730) using the inline input + Set button.
Regression (optional)
Toggle Regression on to add a scatter plot of Buy returns vs. Sell returns with an OLS fit. The regression panel provides:
| Stat | Meaning |
|---|---|
| Beta | Slope of Buy returns regressed on Sell returns |
| Adjusted Beta | Shrinkage-adjusted beta |
| Alpha | Regression intercept |
| R² | Explained variance |
| r | Pearson correlation |
| Std Error (α, β) | Standard errors of the intercept and slope |
| T-test / p-value | Most recent significance test |
When the dataset is very large, the scatter plot is sampled using an inverse-normal-weighted scheme to preserve tails. A Show Full Data / Show Filtered Data toggle switches between the downsampled view and the full set.
Notes
- Missing data points on either side are aligned and filled forward where sensible.
- Correlation and regression windows share the same underlying time series; changing either toggles refreshes both panels.